Full-time Staff
Full-time staff form the foundation of most congregations’ staffing complements. As we will see, however, for the typical congregation this foundation is weakening. There were more congregations without any full-time staff in 2009 than in 2003, and the overall trend was toward reducing full-time staffing complements. In examining these trends we will first look at the distribution of full-time staffing complements in 2003 and 2009, noting differences. We will pay particular attention to the situation where a congregation reported no full-time staff. We will then look at the changes in full-time staffing according to full-time staffing categories in 2003. We will examine these changes in two ways. First, we will look at how full-time staffing complements changed for congregations in the different full-time staffing categories in 2003. Second, we will examine the composition of the group of congregations that made additions and the group of congregations that made reductions.
Distribution of Full-time Staffing Complements in 2003 and 2009
We will look the percentage distribution of full-time staffing complements between 2003 and 2009, first for urban congregations and then for rural ones. For urban congregations only the zero full-time staffing category made percentage gains between 2003 and 2009, growing from 10.8% to 16.9% (see charts 1 and 2). The percentage share of every other staffing category was slightly smaller in 2009 than in 2003.
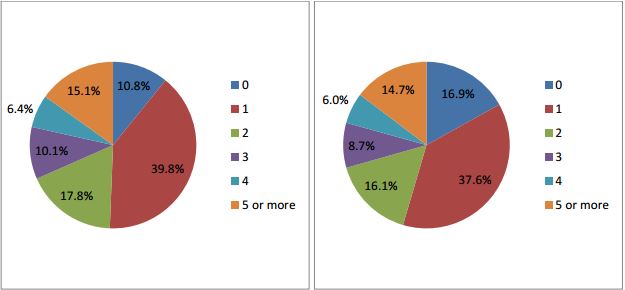
Chart 1. Percentage distribution of urban full-time staffing complements, 2003
Chart 2. Percentage distribution of urban full-time staffing complements, 2009
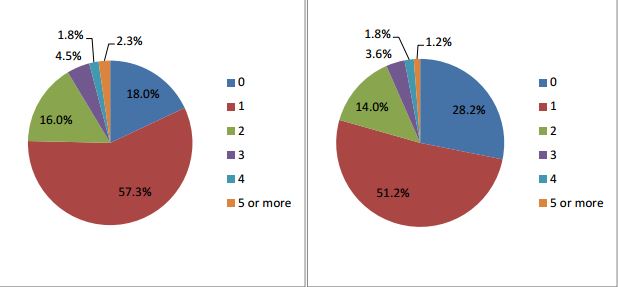
As with urban congregations, the only full-time staffing category that grew between 2003 and 2009 for rural congregations was the zero full-time one, rising from 18.0% to 28.2% (see charts 3 and 4). In 2009, more than three quarters of rural congregations reported 1 or fewer full-time staff compared with just more than half of urban congregations.
Chart 3 (Below Left) Percentage distribution of rural full-time staffing complements, 2003
Chart 4. (Below Right) Percentage distribution of rural full-time staffing complements, 2009
Rural congregations tend to have smaller budgets than urban ones, so a higher percentage of rural congregations with zero full-time staff is not in itself surprising. However the trend toward smaller or no full-time staffing complements for both rural and urban congregations is surprising. We know that the income trajectory for congregations over this period has, as a whole, been positive.10 We expected that congregations with growing income would hire staff, some of which would be full-time. This expected growth in full-time hiring, however, did not happen.
It is difficult to say what might constitute a full-time staffing shortage for a congregation without knowing its particular staffing needs. Some denominations (for example, some Plymouth Brethren and some Mennonite groups) tend not to hire clergy.11 Even if some traditions tend not to hire clergy, most congregations that grow past 40 or 50 members will have administrative needs beyond what can reasonably be expected from volunteers. Having pastoral and administrative needs does not necessarily mean that a congregation will meet these needs with full-time staff. However, most congregations will find that there is a benefit to having at least one person giving consistent full-time oversight to the ministries of the congregation. For this reason, we believe that an absence of full-time staff can reasonably be understood to be a shortage.
Congregations with Zero Full-time Staff
Between 2003 and 2009, the percentage of congregations, both urban and rural, reporting no full-time staff grew. While there was a greater percentage of rural congregations, 28.2%, without full-time staff in 2009 than urban ones, 16.9%, the rate of growth in congregations without full-time staff was roughly the same for both settings, at just more than 50%.
Usually when one tracks changes in growth it is the starting point, in this case the year 2003, that would serve as the reference point (and that is what we will do later on). In the case of zero full-time staff it is also helpful to the question “What full-time staffing levels did the congregations without full-time staff in 2009 have in 2003?” This helps us get at whether we had big congregations, with big staffing complements, or small congregations, with small staffing complements, that are finding themselves in the situation where they have lost all of their full-time staff. In answer to this question, charts 5 and 6 show us congregations that fed the zero full-time staff category in 2009 were reasonably consistent for both urban and rural congregations. About two fifths previously reported zero full-time staff in 2003, another two-fifths had reported just 1 full-time staff in 2003, and the final fifth came from congregations that reported 2 or more full-time staff in 2003 (see charts 5 and 6).
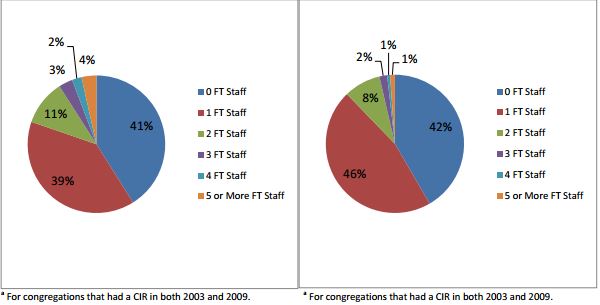
Chart 5 (Above Left). Percentage distribution of urban congregations who reported zero full-time (FT) staff in 2009 according to their reported full-time staffing complements in 2003a
Chart 6 (Above Right). Percentage distribution of rural congregations who reported zero full-time (FT) staff in 2009 according to their reported full-time staffing complements in 2003a
Of the congregations that had full-time staff in 2003, 9.2% of urban congregations and 16.2% of rural congregations reduced those full-time complements to zero by 2009. While this looks particularly alarming for rural congregations, one must remember that a greater percentage of rural congregations had just one full-time staff, 57.3%, than urban ones, 39.8%, in 2003. When full-time staffing levels are modest it of course takes fewer reductions to get to zero.
Looking now at congregations that had zero full-time staff in 2003, 39.8% of urban congregations and 33.8% of rural congregations reported adding at least one full-time staff person by 2009 (data not shown). Further study is needed to determine why these congregations that previously had zero full-time staff added to their full-time staffing complement while others did not.
Full-time Staffing Reductions
Charts 1 through 4 showed the full-time urban and rural staffing distributions for 2003 and 2009. We have already noted where the major changes to the distributions occurred; however, this just provides us with two snapshots and does not tell us anything about the movement of congregations between full-time staffing categories.
Which congregations were adding and which were reducing full-time staff? Were there differences according to the full-time staffing complement that congregations started out with in 2003? Did the trends look different for urban and rural congregations?
The larger an urban congregation’s full-time staffing complement was in 2003, the greater the likelihood that it would reduce full-time staff, a pattern that seemed to hold for rural congregations as well (see charts 7 and 8).12 However, irrespective of the full-time staffing complement in 2003, rural congregations were more likely to reduce their full-time staffing complements than urban ones.
Chart 7 (Below). Urban congregations that made reductions to their full-time (FT) staffing complements between 2003 and 2009, count and percentage of their full-time staffing category in 2003
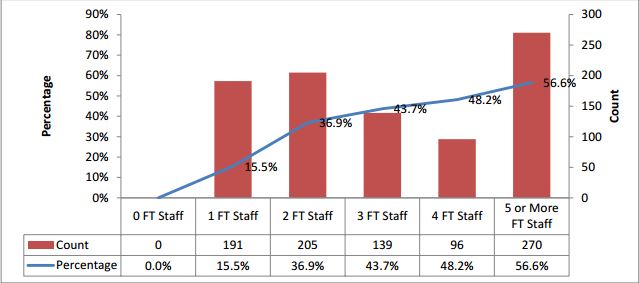
Chart 8 (Below). Rural congregations that made reductions to their full-time (FT) staffing complements between 2003 and 2009, counta and percentage of their full-time staffing category in 2003
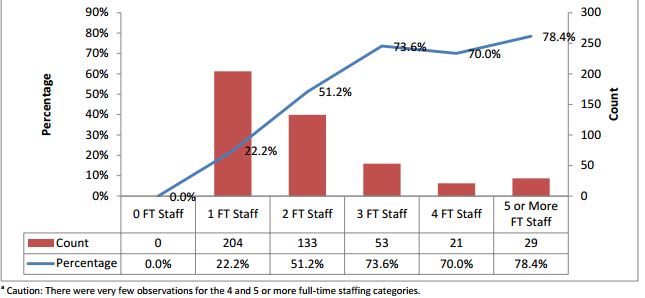
About the same percentage of urban and rural congregations made reductions to their full-time staff between 2003 and 2009, 28.9% and 27.6% respectively. How does this result arise when rural congregations in any given staffing category in 2003 were more likely to make reductions than the congregations in the corresponding urban full-time staffing category? The answer is that the distributions of full-time staffing categories in 2003 were different for urban and rural congregations. Rural congregations disproportionately have small full-time staffing complements, while urban congregations tend to have larger ones. Though rural congregations are more likely to make reductions according to their full-time staffing category in 2003, the size of the category from which these bigger percentage bites are taken makes the difference in the overall percentage of congregations making reductions. By examining the counts in charts 7 and 8 one can see the differences in the contributions to the total number of reducing congregations for urban and rural churches according to full-time staffing category in 2003.
Full-time Staffing Additions
While the percentages of congregations making full-time staffing reductions were similar for urban and rural settings, a greater percentage of urban congregations, 25.8%, made additions than did rural congregations, 14.4%.
The patterns of additions across the full-time staffing categories in 2003 are different as well. We know that, of those congregations that did not have full-time staff in 2003, more than a third had added full-time staff by 2009. Such a large percentage of additions within this category of zero full-time staffing in 2003 suggests it was a high priority for congregations to have a least one person giving full-time oversight to the ministries of a congregation.
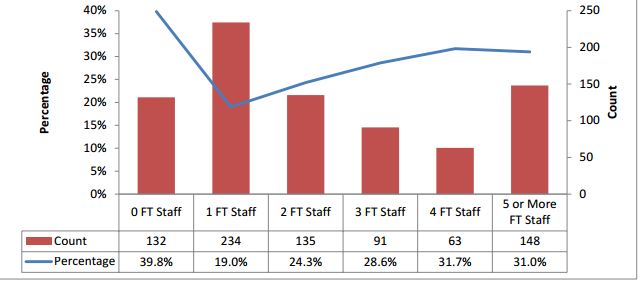
When we consider the other (1 or more) full-time staffing categories for urban and rural congregations, we see two different patterns emerging. As one views urban full-time staffing complements in 2003 moving from small to large, congregations were more likely to have made full-time staffing additions by 2009 (see chart 9). This trend is similar to, albeit weaker than, what we saw for urban congregations that made reductions. This suggests that there is a greater level of full-time staffing level volatility among larger urban congregations than among smaller ones.
Chart 9 (Below). Urban congregations that made additions to their full-time (FT) staffing complements between 2003 and 2009, count and percentage of their full-time staffing category in 2003
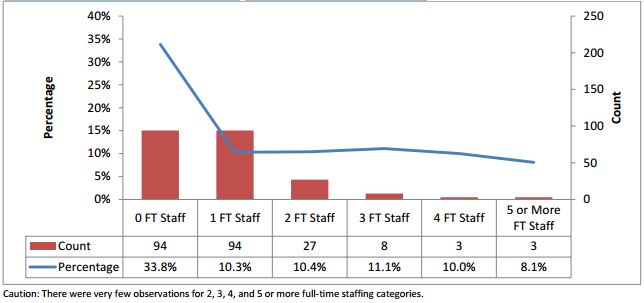
 When we look at the likelihood of rural congregations making additions across the full-time staffing categories in 2003, the pattern is strikingly flat at around 10% (with the exception of zero full-time staff, see chart 10). A rural congregation that had a larger full-time staffing complement in 2003 was no more likely to make full-time staffing additions by 2009 than was a congregation with a smaller staffing complement. When additions were made, they came almost exclusively from congregations that had zero or one full-time staff in 2003.
Chart 10 (Above). Rural congregations that made additions to their full-time (FT) staffing complements between 2003 and 2009, count and percentage of their full-time staffing category in 2003
 Considering the patterns of rural additions and reductions, the trend is one that would see significant rural fulltime staffing shortages. Consider that in 2009, 28.2% of rural congregations reported zero full-time staff and that 13.2% more rural congregations made reductions in full-time staff than made additions between 2003 and 2009 – and this over a time span of just 6 years! It is conceivable, if current trends continue, that a decade from now half of rural congregations will be without full-time staff, and most will be reduced to just one.
Before considering the part-time staff, it is helpful to consider the net picture of the changes that are occurring with full-time staff.
Of urban congregations, 28.9% made reductions to their full-time staff while 25.8% made additions, for a 3.1% net trend toward reductions. On the other hand, 27.6% of rural congregations made reductions to their full-time staff while just 14.4% made additions, for a 13.2% net trend toward reductions.
Most full-time staffing reductions were reductions of just one staff. Of those congregations who reported staffing reductions, 57.2% of urban congregations and 76.1% of rural congregations reported reductions of just one full-time staff. Most rural congregations, however, had just one full-time staff person to lose, and when rural congregations reduced their full-time staffing complements by 1, 57.3% of those dropped to zero full-time staff. Urban congregations, on the other hand, are making bigger staffing changes. Of urban congregations that made full-time reductions, 48.2% reduced their full-time staff by two or more, while 46.5% of those that made additions to full-time staff made additions of two or more.
12 The numbers of observations for rural congregations with 4 and 5 or more full-time staff (32 and 37, respectively) are too small for us to say the pattern holds for rural congregations with the same confidence as for urban ones (see chart 8).